Roads in Iowa, South Dakota among Worst in U.S. for Truck Accidents
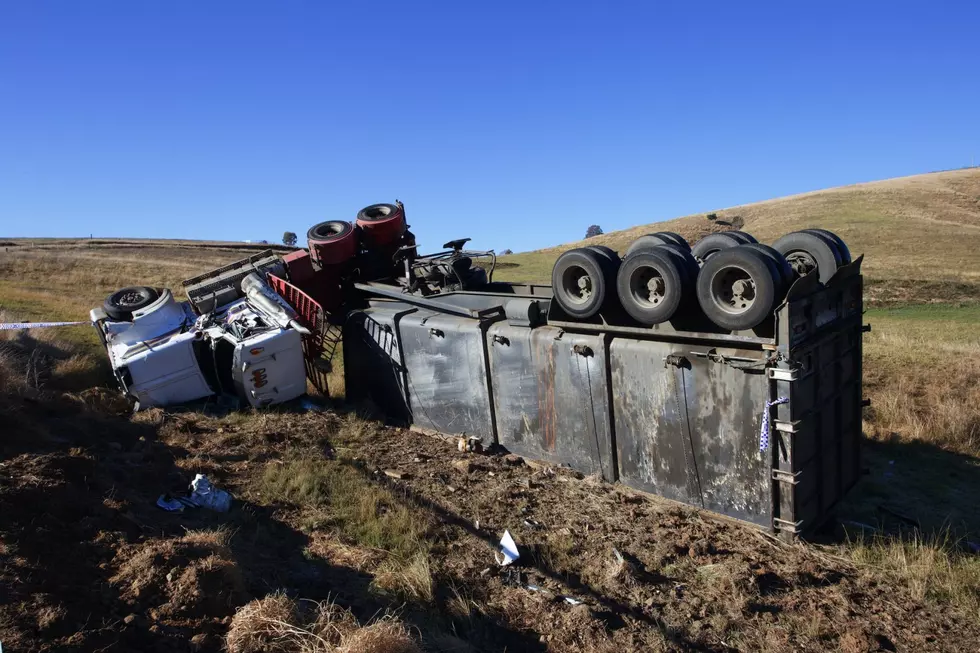
One of the most dangerous places to be in Iowa and South Dakota is on the open road, especially if you're driving a truck.
The Hawkeye and Mount Rushmore States are both in the top ten among states with the highest number of trucking accidents.
New research from personal injury lawyers WeWin, examined the most recent data from the National Highway Traffic Safety Administration to discover which states had the highest percentage of crash fatalities that involved large trucks.

Iowa ranks fourth for the highest number of vehicle accidents involving trucks, with 467 vehicles involved in fatal crashes, 67 large trucks involved in fatal crashes, and 14.3 percent of fatal vehicle crashes involving trucks
South Dakota was close behind in sixth place.
The 2020 numbers had 191 total vehicles involved in fatal crashes, 24 large trucks involved in fatal crashes, and 12.6 percent of fatal vehicle crashes involving trucks.
Another rural state, Wyoming, led the nation with 19% of all fatal accidents involving trucks.
That figure is 100% higher than the national average.
MOST TRUCK ACCIDENTS
- Wyoming
- Idaho
- Nebraska
- Iowa
- North Dakota
- South Dakota
- Alaska
- Kansas
- Indiana
- Texas
At the other end of the spectrum, Washington DC had the lowest number of truck accidents.
D.C. had the lowest number of total vehicles involved in fatal crashes in the country, with 50 crashes, two of these involving trucks, equating to four percent of all fatal vehicle crashes.
FEWEST TRUCK ACCIDENTS
- Washington D.C.
- Michigan
- Vermont
- Hawaii
- Delaware
- Massachusetts
- Connecticut
- New Jersey
- Maryland
- Nevada
Nationwide in 2020, there were 4,965 people killed and an estimated 146,930 people injured in crashes that involved large trucks.
MOST RECKLESS DRIVERS' VEHICLES
See the Must-Drive Roads in Every State
LOOK: See how much gasoline cost the year you started driving
More From KIKN-FM / Kickin' Country 99.1/100.5