Potholes Are Few and Far between in South Dakota
The wild fluctuations in temperatures we're seeing this week not only take a toll on our bodies, they're no picnic for our roadways either.
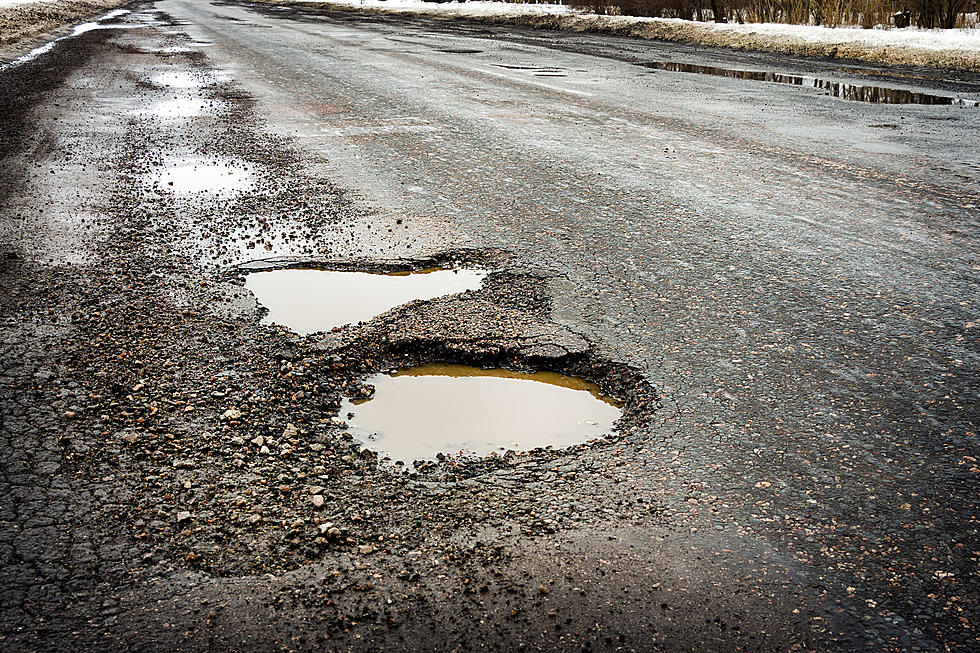
All of this freezing and unfreezing causes pavement to expand and contract which eventually leads to one of our least favorite things to encounter when behind the wheel.
Potholes.

Now you'd think with all of the extreme weather we get in South Dakota that we'd be high on the list of states with the largest number of pothole complaints in the nation.
Think again.
Stacker.com looked at data from the national transportation research nonprofit TRIP and the website The Clunker Junker and found that drivers in the Mount Rushmore State actually reported only one pothole per 1,000 kilometers of road (621 miles) - which is the fifth lowest in America behind only Idaho, Wyoming, Montana, and New Mexico.
STATES WITH FEWEST POTHOLE COMPLAINTS (per 100km of road)
- Idaho (0.4)
- Wyoming (0.6)
- Montana (0.8)
- New Mexico (0.8)
- South Dakota (1)
- Iowa (1.1)
- Arkansas (1.3)
- Kansas (1.8)
- North Dakota (1.9)
- Delaware (2)
So do we actually have an incredibly low number of potholes or are we just not so good about reporting them?
Drivers in South Dakota are able to get the latest road info on the state's Department of Transportation 511 website for up-to-date road conditions and construction information. The state also maintains what it calls a 'needs book', where data is broken down for every highway in terms of its condition and maintenance profile.
In all, 40% of U.S. roadways are in poor or mediocre condition, which contributes to the average cost to a single driver of $621 per year for vehicle repair and maintenance.
That translates to more than $140 billon when you factor in the total number of drivers in the United States.
STATES WITH MOST POTHOLE COMPLAINTS (per 100km of road)
- Rhode Island (23.4)
- Hawaii (20.6)
- New York (20.5)
- Massachusetts (18.7)
- California (18.4)
- New Jersey (16.5)
- Maryland (15.5)
- Pennsylvania (15.4)
- Connecticut (12)
- Florida (11.4)
LET'S GO: The most popular historic sites in America
LOOK: See how much gasoline cost the year you started driving
See the Must-Drive Roads in Every State
More From KIKN-FM / Kickin' Country 99.1/100.5